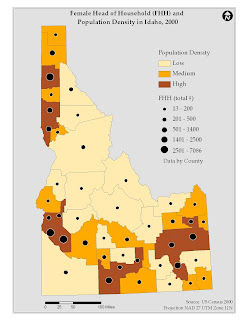
The Female Head of Household and Population Density in Idaho map was constructed using US Census Bureau information from the year 2000. The census data is contained within a shapefile of Idaho counties. This map displays two variables using color hues for population density and a graduated circle to represent the total number of female head of households by county. The bivariate map allows the viewer to look see two variables represented simultaneously. Looking at the population density colors, one notices a high population density in the north as well as belt of high population density in the south. It also appears that the number of female headed households is correlated with higher population densities. The bivariate map is an easy way to look at two variables and how they coincide in space. I think the only limitation is in designing a clear legend.
No comments:
Post a Comment